| Back to the previous photograph | |
|
| |
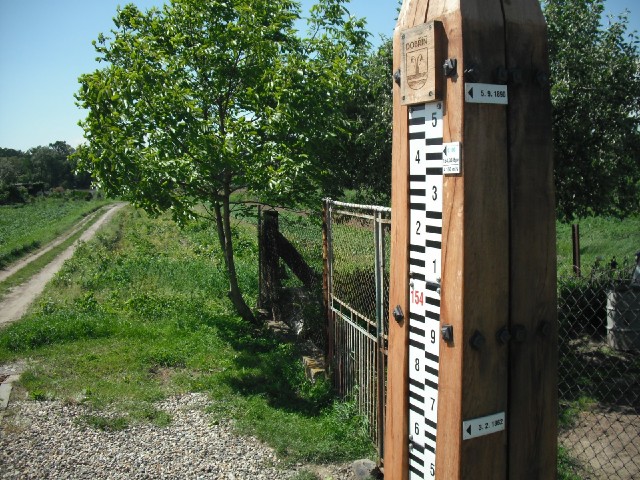
 This must relate to river levels. The scale of the front must be metres above sea level. On the side are the high water marks from some floods. The little square stuck on the front indicates a flow rate of 4150 m3/s. There are two similar markers with lower flow rates off the bottom of the picture. A little way further up the hill is a similar monument showing the 2002 flood at 156.3 metres. It doesn't give a flow rate for that. UTC Time: 12:44, Monday 07 June 2010 Local Time: 14:44, Monday 07 June 2010 Estimate of longitude: 14° 17' 29.80" E = 14.291610° Estimate of latitude: 50° 26' 16.69" N = 50.437970° Possible error on position estimate: 10 metres | |